Nearly three years have passed since Elon Musk bought Twitter and rebranded it X. Despite early claims of its demise and minor exoduses, X still remains the most critical social media platform for breaking news, political narrative setting, and engaging the parties' bases.
Here are eight stats about X that you need to know to make sure you're taking the platform seriously.
1. 55% of daily US users still call it Twitter
Another 21% of daily X users report using both names interchangeably, so despite the rebranding, it will likely take time for the habit of calling it Twitter to subside. When mentioning the platform to voters or the general public, make sure you use both names to avoid any confusion.
2. X is the 4th most popular social platform among voters.
In the Center for Campaign Innovations 2024 Post-Election Survey, 19% of voters said they used X daily, tied with TikTok in fourth place behind Facebook, YouTube, and Instagram. Among all US adults, X is 10th, meaning it is an important channel for reaching engaged citizens.
3. The average organic engagement rate on X is 1.6%
On X, the engagement rate for a given period of time is calculated by the number of Comments, shares, likes, save, clicks, and DMs relative to your followers and how many times you post. Xs average is higher than Facebook, but less than LinkedIn, TikTok, and Instagram.
Source: HootSuite
4. The average weekly posting frequency on X is 61
This is more than any other social media platform and works out to about 9 posts every day.
5. The optimum number of posts per week for minimum engagement is 6
If you can't muster that many posts, you want to at least reach 6 per week to maintain your account since the X algorithm prioritizes reach for active users.
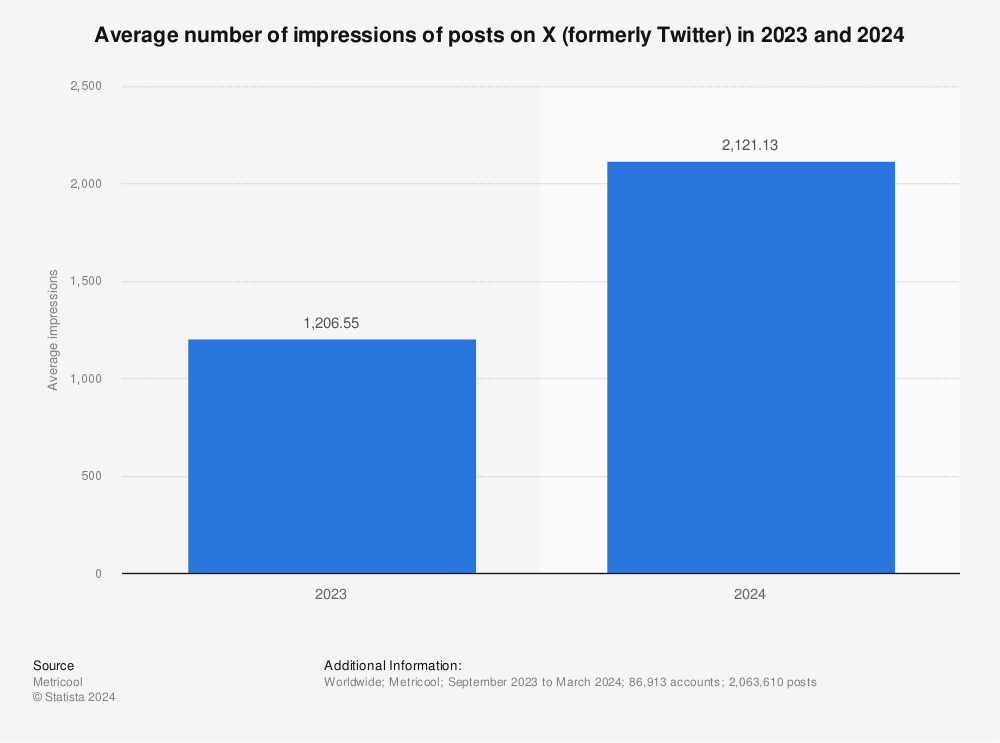
6. The average number of impressions per post is 2,121.13

7. Men are more likely than women to use X
25% of American men use X compared to 17% of women. Facebook, Instagram, and TikTok each have more female users than male.
8. 59% of X users use the platform to follow politics
According to Pew Research, about three-quarters of users (74%) see at least some political content on X.
Conclusion
The saying Twitter isn't real life still holds true for X, but for campaigners who are serious about having a voice and shaping the conversation around their race, issues, and news of the day, it remains an essential platform.


